Appearance
Pictograph widget
Map Data Points to Icons of Physical Objects
Basic Setup
Pictograph Widgets, enabling you to associate data points with icons symbolizing diverse physical objects and their status or value.
- Enter Widget name
- Select data presentation
- Map desired pages to Rows / Columns
Advanced Settings
Unlock advanced capabilities with the pictograph widget. Map data points to Icons. Define minimum-maximum values and set preffered colors, streamlining data reflection through representational icons aligned with the data type.
- Select multiple-lines
- Rename label of the selected data points, to auto align.
- Set different icons and settings for seperate lines.
Note
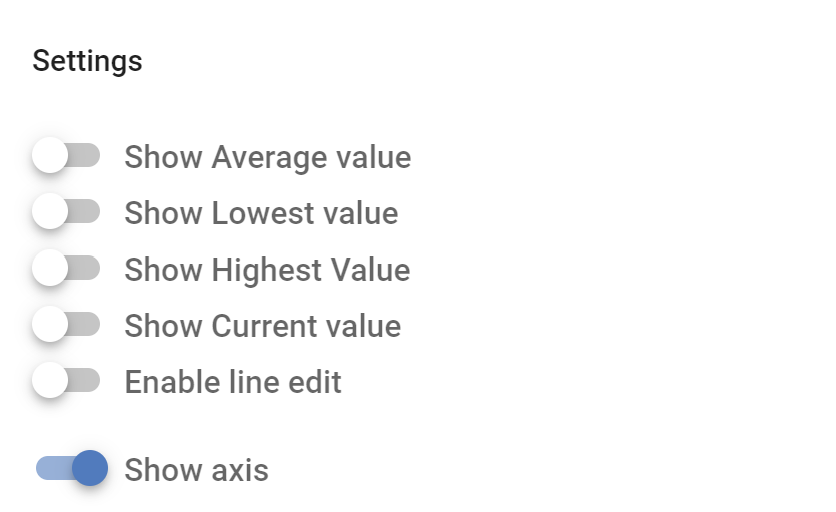
Refined Customization: Additional Settings for Fine-Tuning Widget Adjustments