Appearance
Graph widget
Seamlessly visualize and compare historical data for more informed decision-making. Effortlessly visualize and compare historical data, turning each data point into a graph for simplified interpretation. Uncover insights seamlessly, making complex information more accessible and enhancing informed decision-making.
Basic Setup
Simply add the graphs that you want to compare to the widget. Default the pages / lines that don't contain graphs are grayed out.
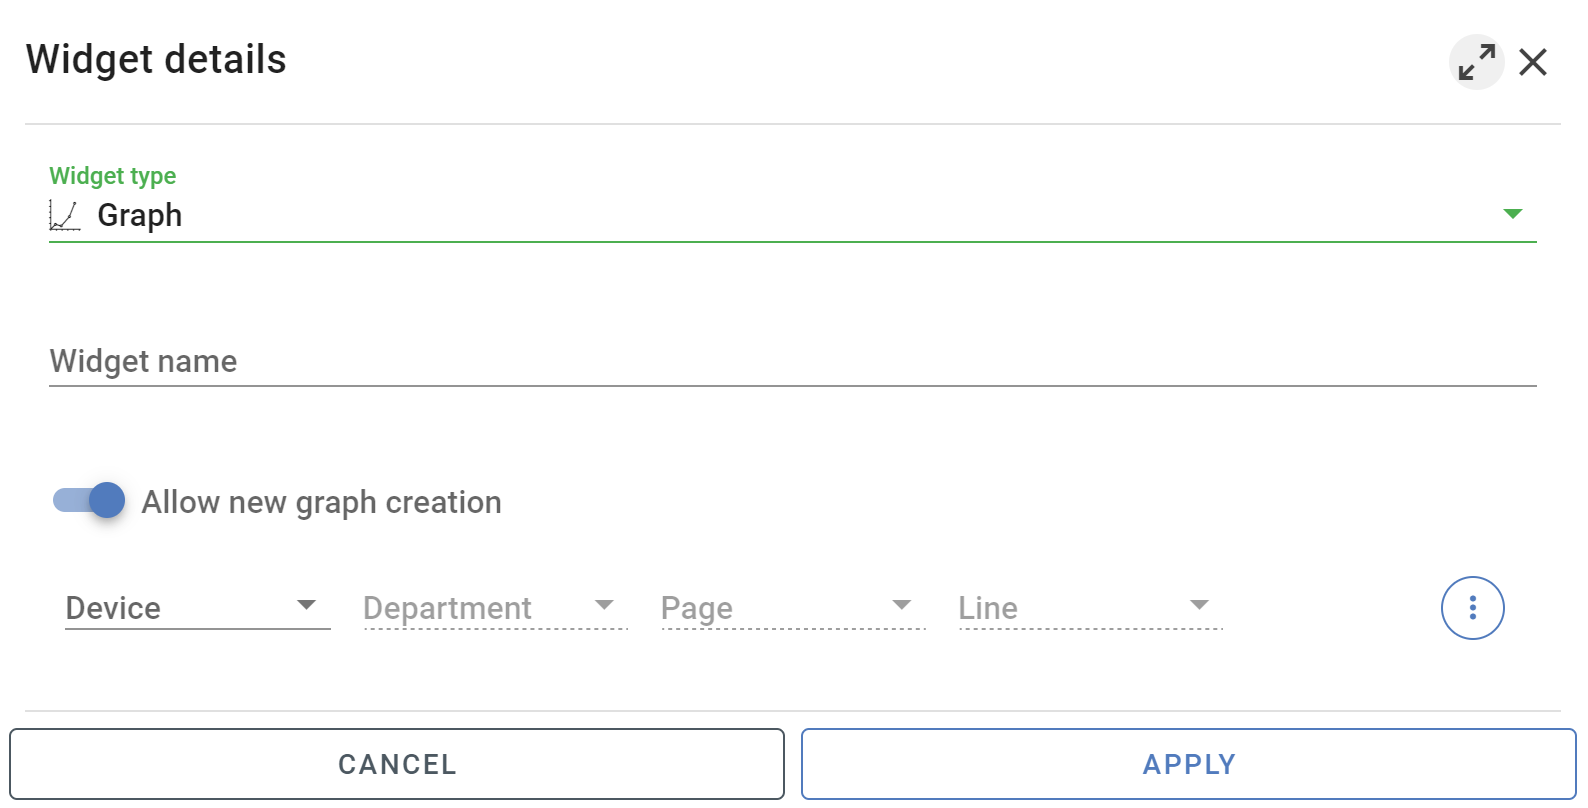
- Enter Widget name
- Add desired graphs
Advanced Settings
Unlock advanced capabilities within the Graph Widget. Add annotations to highlight key insights, download specific datapoints for in-depth analysis, compare different time periods effortlessly, and enjoy the flexibility to create or modify graphs to suit your needs. Elevate your data exploration and maximize your decision-making potential.
add annotations
Note
Default label is displayed vertically. Bay placing a + in front of the label, the label becomes horizontally positioned.
download datapoints (selected period)
Note
As an alternative, you have the option to download the graph as an image.
Select interval
Note
Modify the graph period swiftly by clicking the clock icon and adjusting the time range for immediate interaction. For altering the default loaded time period whenever the dashboard opens, make the changes in dashboard editing mode. Additionally, by setting a future date, the graph will dynamically update until that specified moment in time.
compare two time periods (2 X-axes)
Graph settings
Customize your graph settings with ease. Tailor the label, select your preferred graph color, and enable options for displaying average, high, and low values. Personalize your visualizations for a more tailored and insightful data representation.
Note
Exercise caution when modifying the graph's start time and interval. Such alterations have a direct impact the graph collection.
Create graph
By enabling Allow new graph creation a graph will automatically be created for the selected line(s). Default the start-time is set to 00:00 and the inteval to every hour. This of course can be adjusted by going to the line settings.